SMP Maps : Interactive Web-GIS in Minecraft

SMP Maps : Interactive Web-GIS & Transit Visualization in Minecraft (December 2025 - January 2026)
Introduction and objectives
Between 2020 and 2021, I built a complete subway network on a Minecraft multiplayer server. However, I was the only one who really knew how to use it...
This project was born in response to the issue I faced at the time: how do I make a dense and complex transport network readable, navigable, and accessible?
I had indeed created a schematic plan of the network as well as line diagrams, but these remained rather vague for many players.
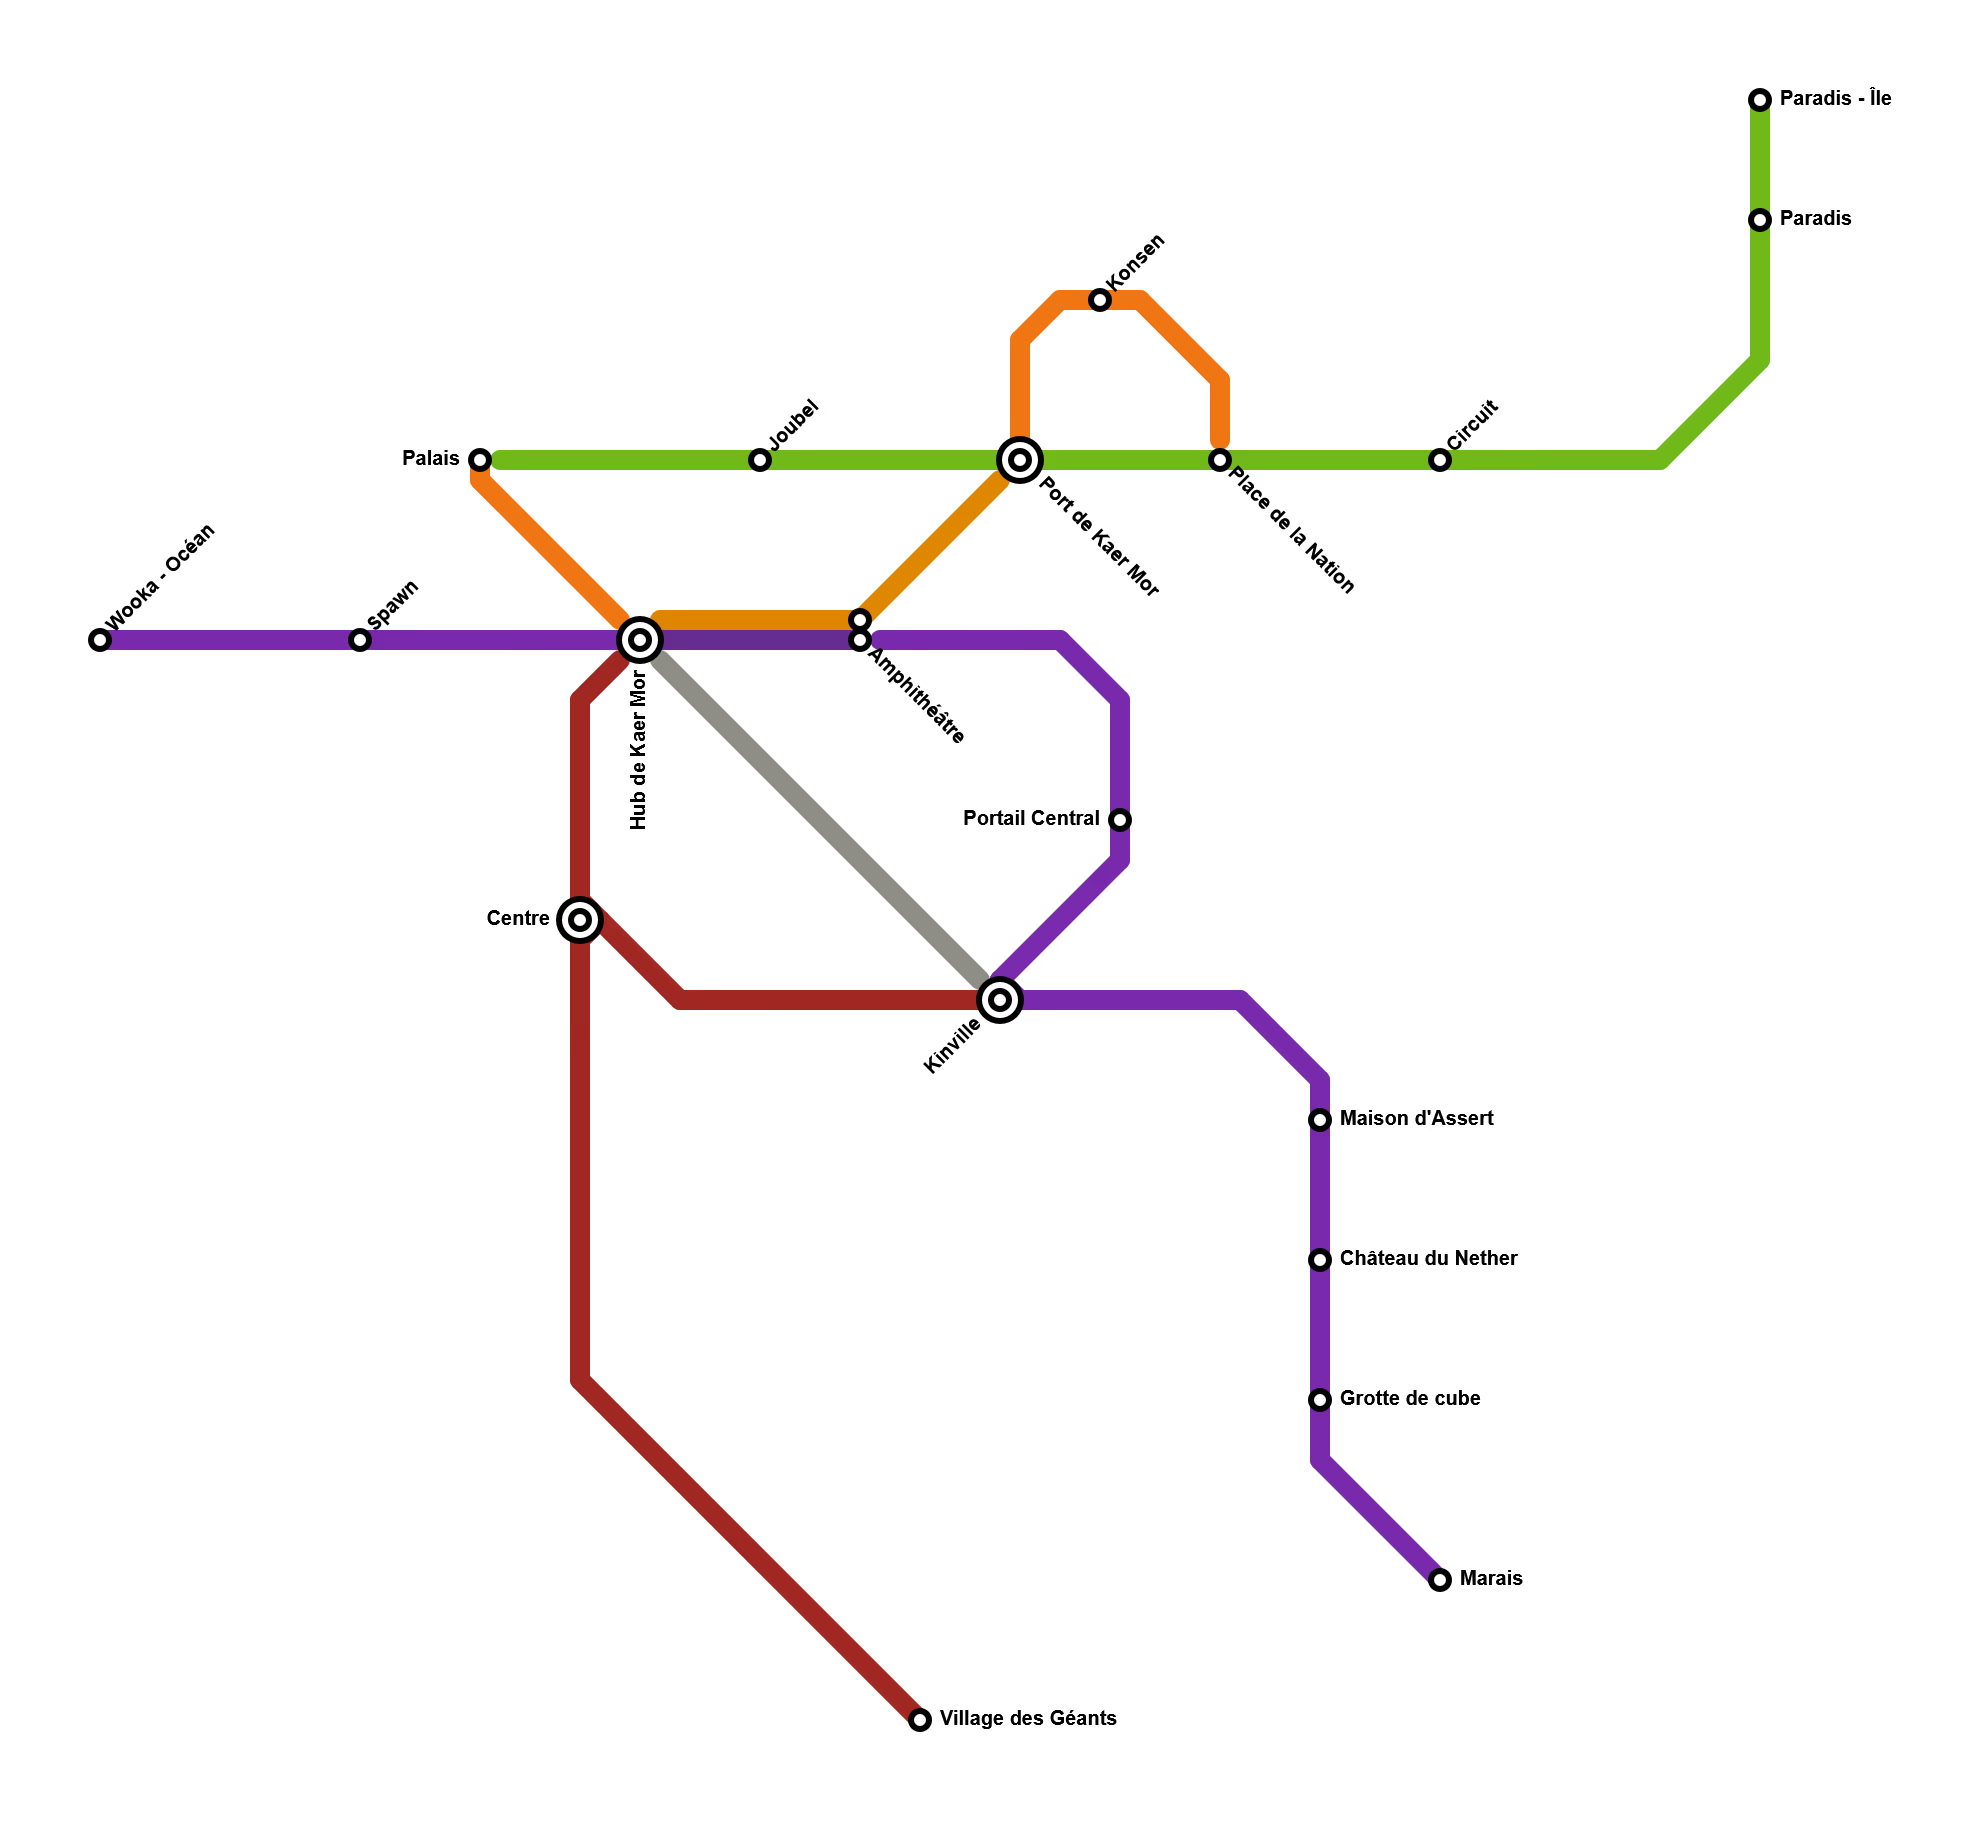
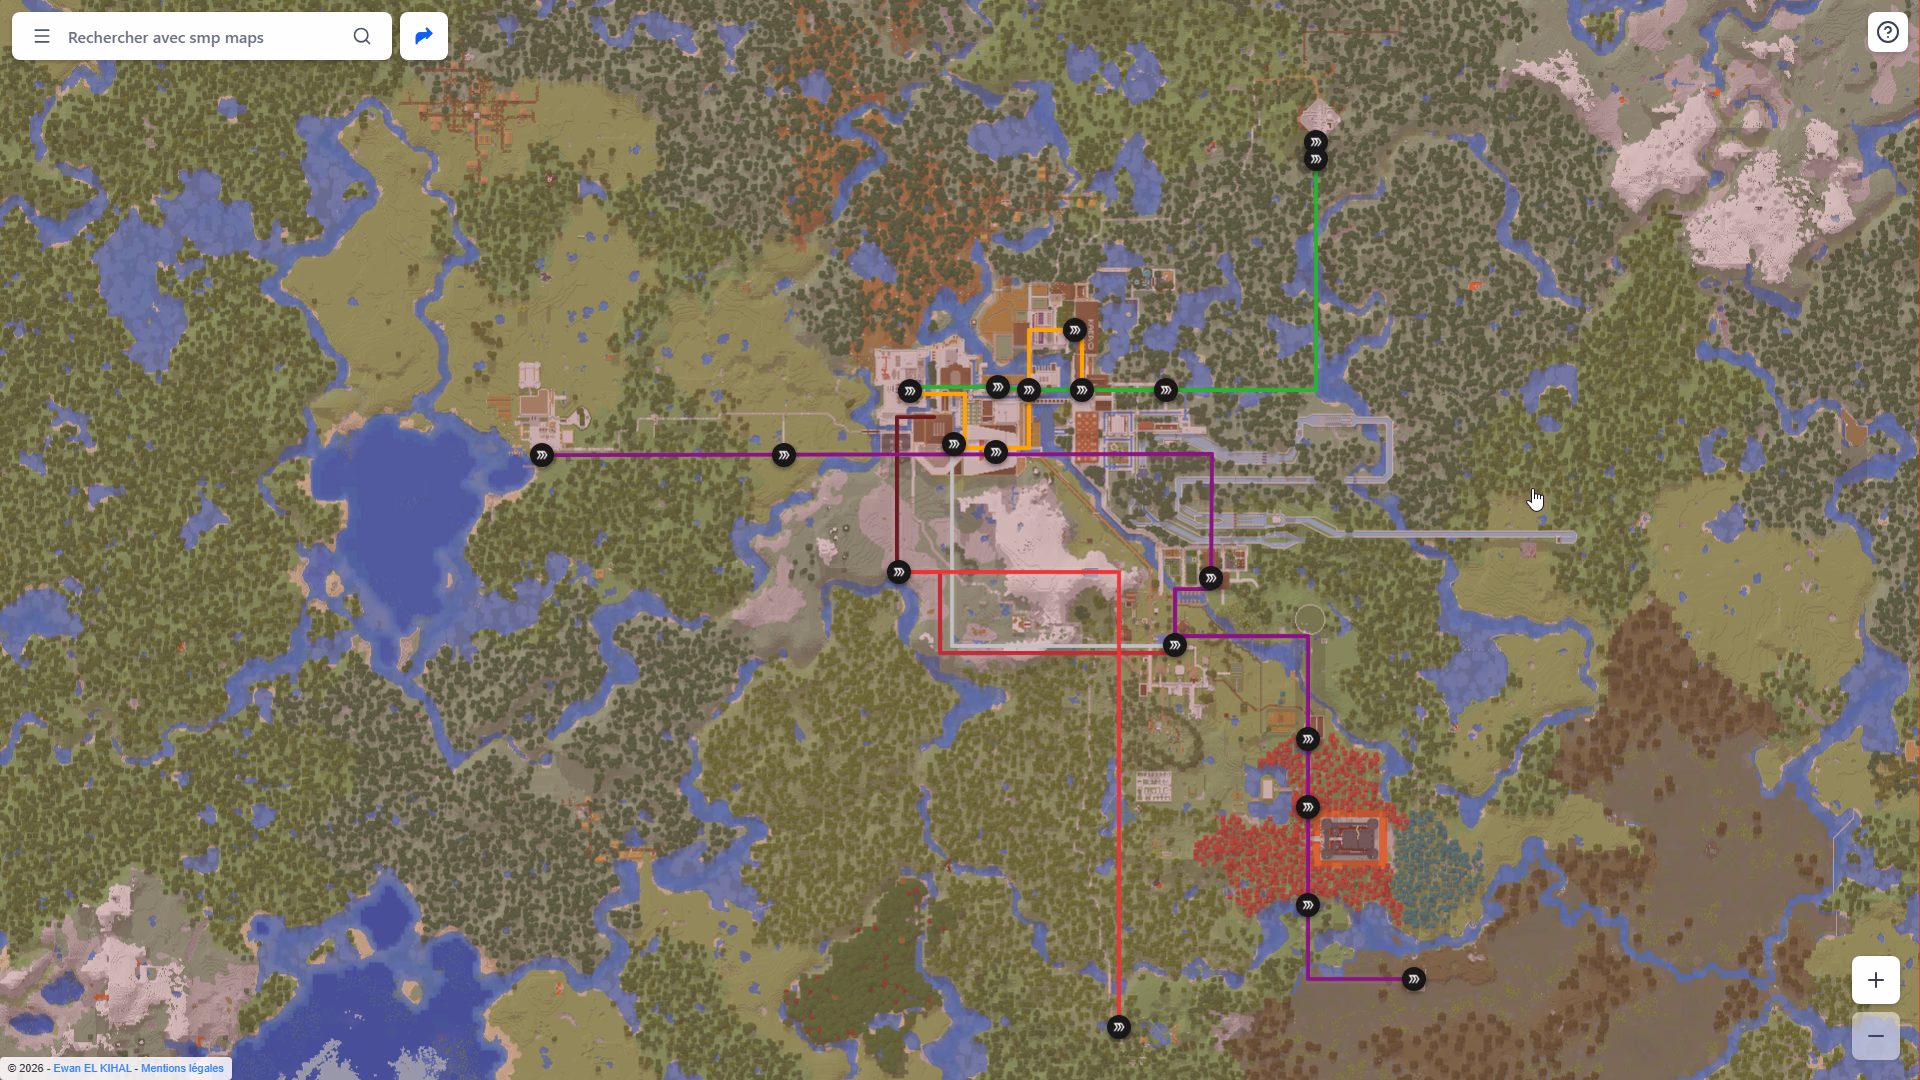
Overview of the schematic network plan. Stations with a double circle are hubs (major stations)
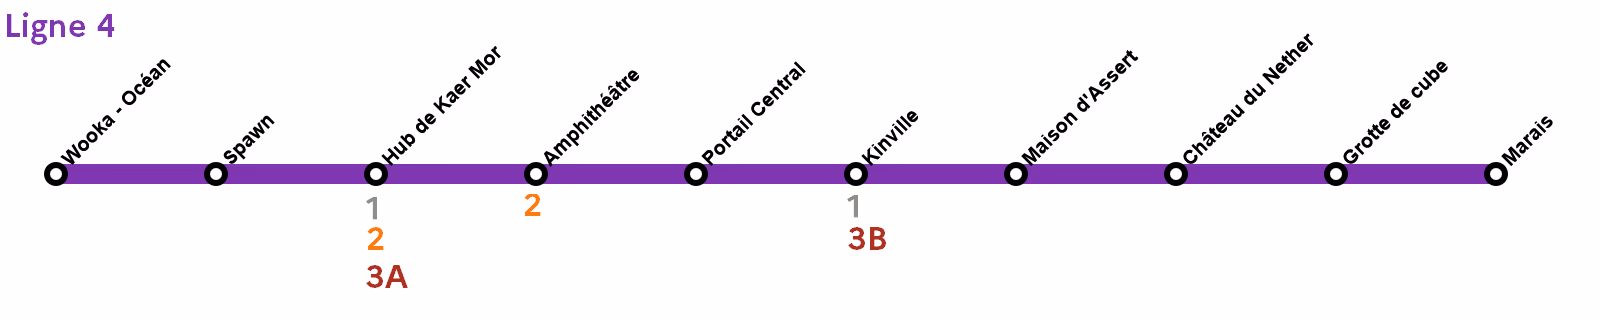
Overview of the Line 4 diagram, with connections
In an experimental and virtual urban planning approach, I designed a real-time "Google Maps" style navigation tool allowing players to calculate the fastest route while taking into account the specific physics of the game.
- Problem: How to transform a barely readable virtual transport network into a clear, multimodal, and functional transport map?
- Objective: Develop a complete web application, from raw data collection to the user interface.
The station names presented in this portfolio have been anonymized or modified to respect the privacy of the server and its users.
Data creation & pure GIS with QGIS
This crucial phase allowed for transforming the game world into usable data. It demonstrates mathematical rigor and my learning of GIS tools.
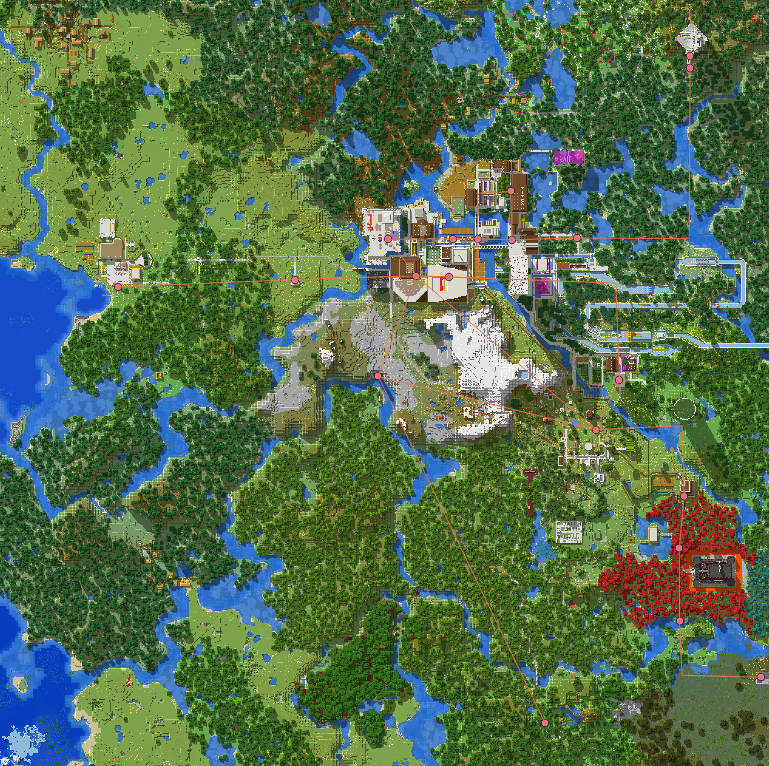
Map Export
First, I used the tool uNmINeD to export a map from a backup of this server. In order to have a sharper image on the website, I exported the image in 4x (where 4 pixels = 1 block in the game). The exported map is a square of 2048 meters on each side.
Creating the QGIS Project
I then created a Cartesian QGIS project (simple 2D coordinates) in EPSG:3857, which is the coordinate system used by Google Maps and OpenStreetMap (and therefore Leaflet, which I use in this project). This type of map allows for the easy use of meters as a unit, which is exactly what is needed for Minecraft where each block corresponds to one meter.
Georeferencing and Precision
I used the QGIS Georeferencer to align my raw 4x raster map with the projected coordinate system. The use of Ground Control Points (GCP) ensured precision down to the block, which is indispensable for in-game navigation.
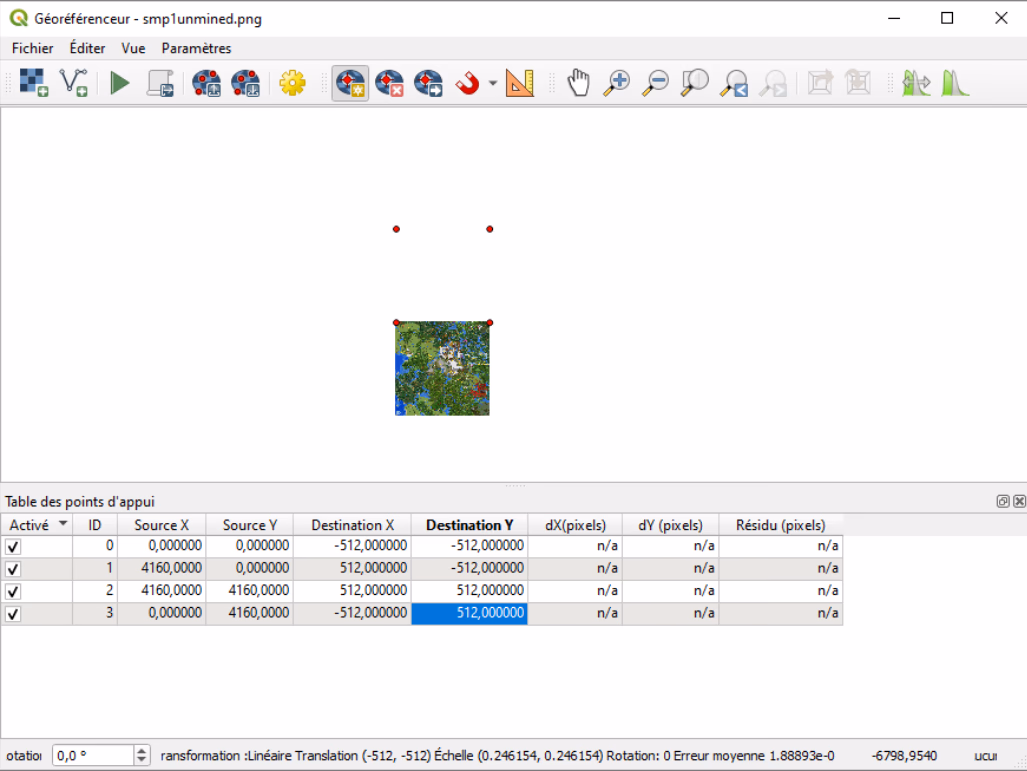
Configuration of the georeferencer for a map with coordinates ranging from -1024, -1024 to 1023, 1023
I then transformed the map linearly.
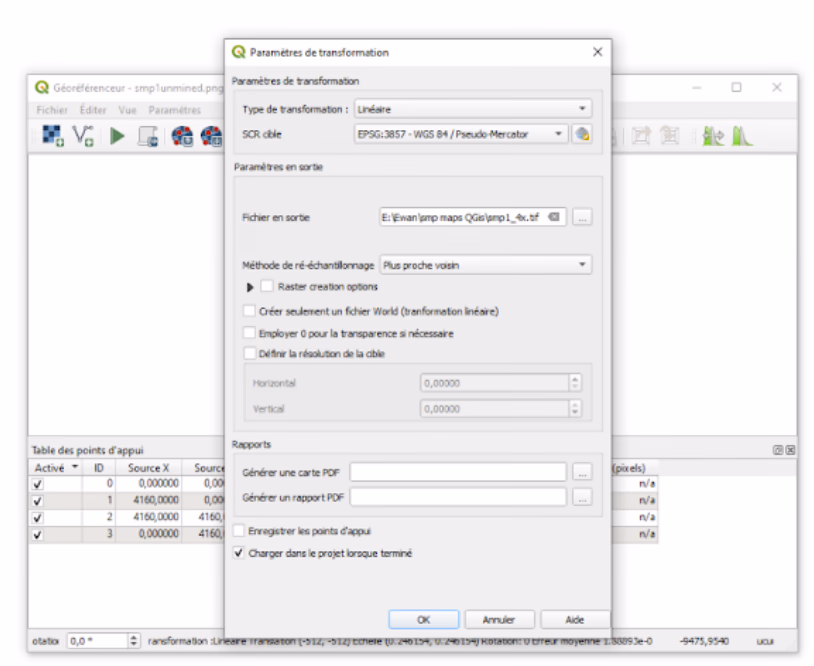
Transformation parameters
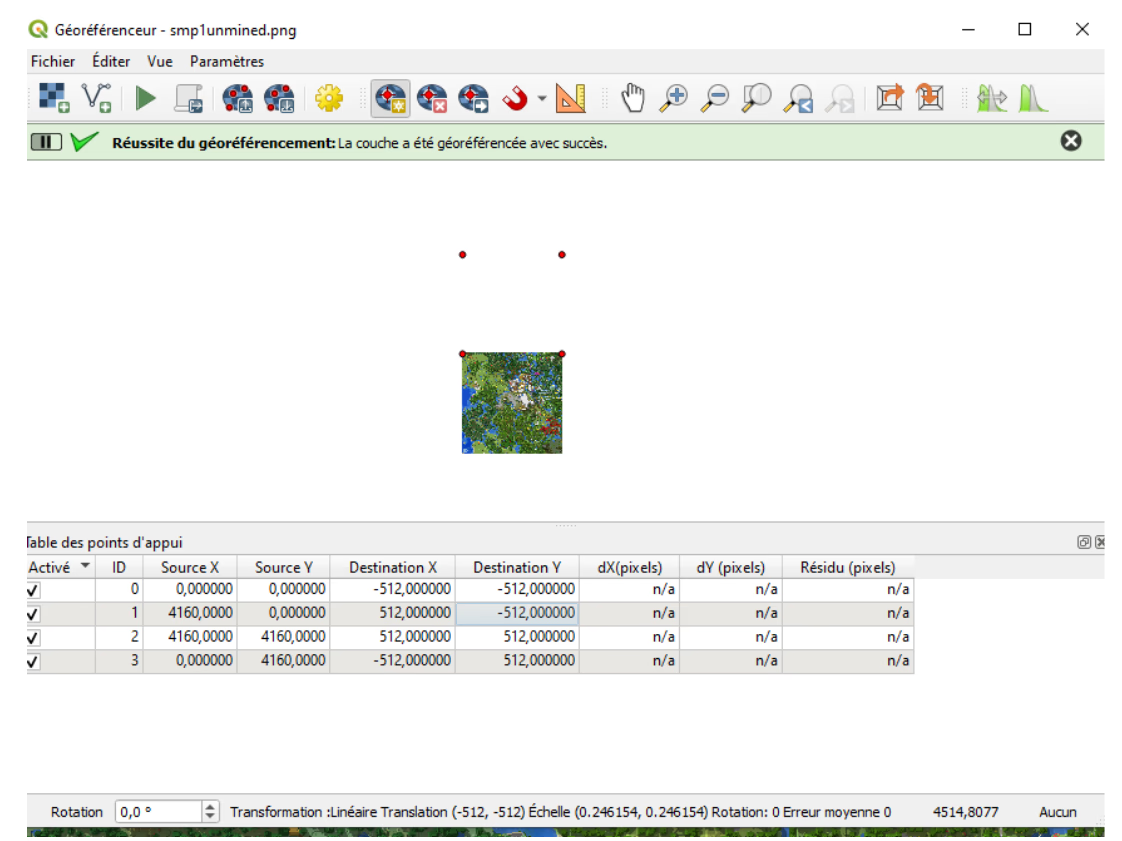
Georeferencing once successful
Creating Layers
I then created the stations and lines layers via the tools provided by QGIS to be able to place stations and lines. I had initially aligned the stations on the map manually by clicking on them, but this method proved imprecise and unsuited for Minecraft, where coordinates must be precise to the meter to have realistic travel times. The coordinates were recorded directly from the game.
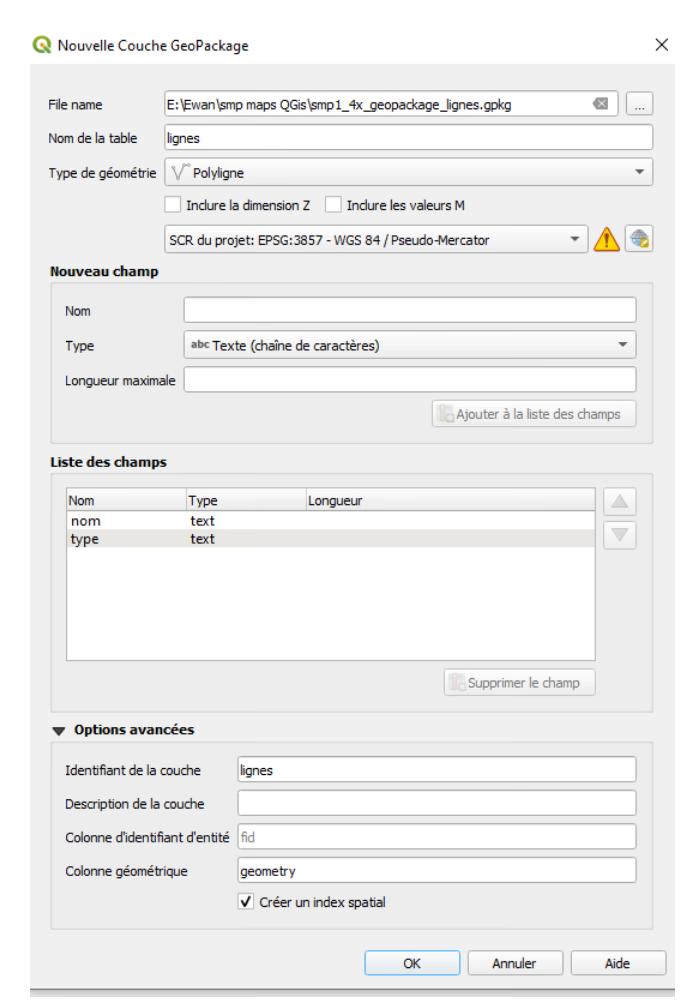
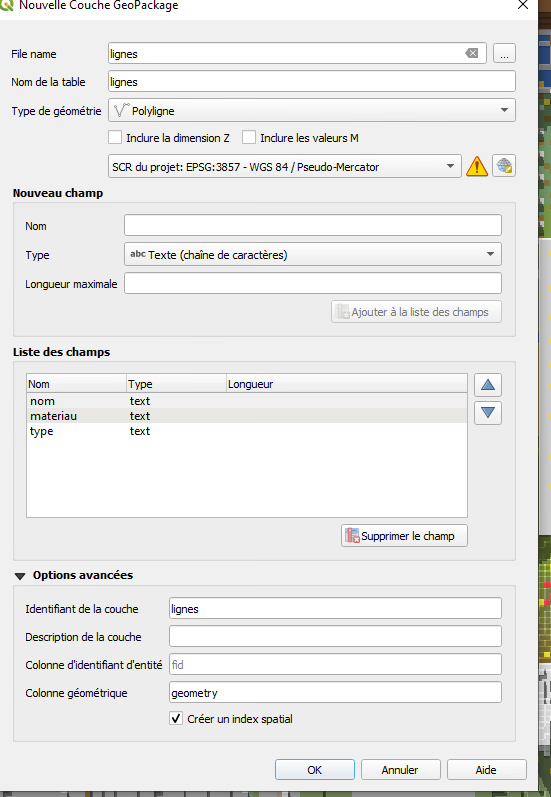
Initial creation of the lines layer
The type attribute corresponds to the type of line (metro, TGV, etc.). Here, only the ice boat metro has been implemented. The metro lines in this network are ice lines that players traverse with a small boat. Depending on the type of ice used, the maximum speed reached is faster or slower.
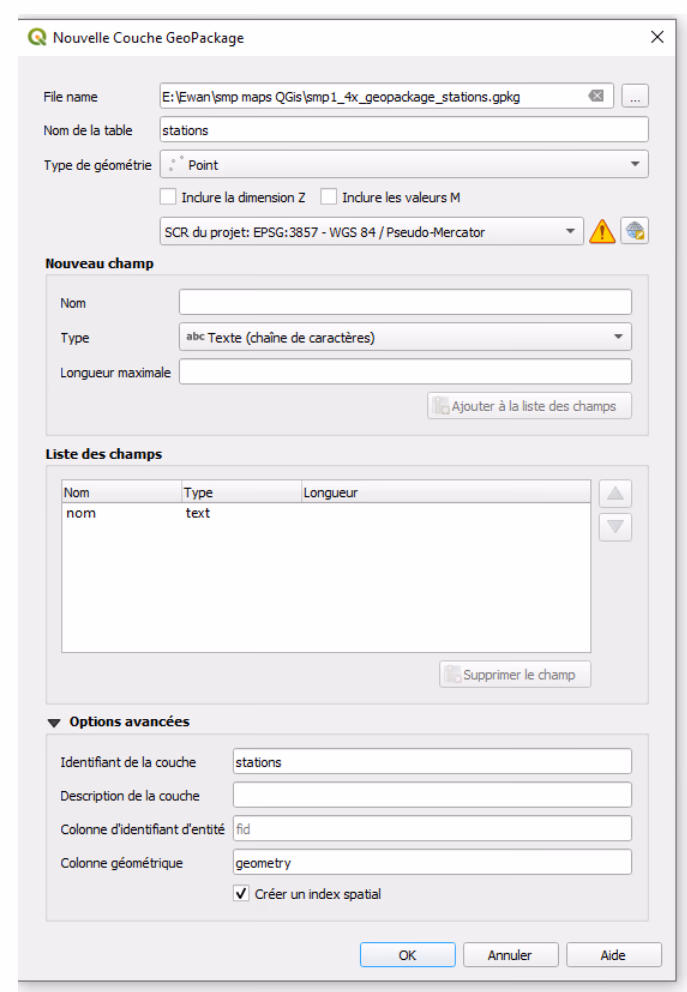
Initial creation of the stations layer
For a first version, I had therefore filled in the lines manually using edit mode and drawing polylines by clicking on each station of each line in sequence.
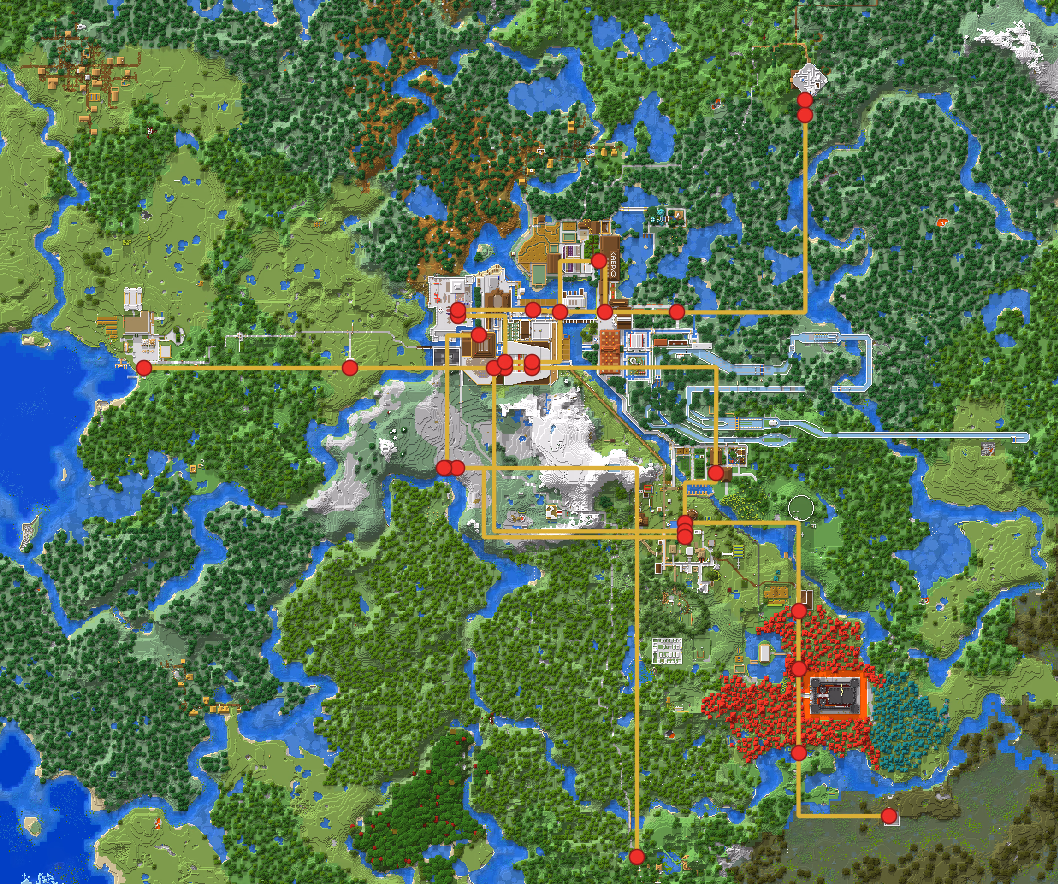
First rough modeling
Many problems can be noticed: not only are geographically aligned stations not perfectly aligned, but some stations create diagonals, whereas all angles are right angles in the real metro network in the game! Also, Minecraft has a non-standard coordinate system where map coordinates are not really in (x; y) but rather in (x; z). To convert them into a format that QGIS understands, y must be replaced by -z.
I therefore had to think about major changes to improve the situation.
Changes to Layers
I decided to make the following choices:
For stations
- Create one station per platform for stations that have several (usually one per line)
- Add a "hub_id" parameter which allows grouping the different platforms of a single station
For lines
- Add a special "Paradise Elevator" line. Indeed, between the stations Paradis and Paradis - Île, there is a vertiginous elevator which has a fairly long duration and does not correspond at all to the rest of Line 5.
- Add a "material" parameter because one line (Line 1) has a different material from the others allowing for faster travel.
- This line has another new parameter, the "duration", which allows defining the ascent time (which was measured by me).
Furthermore, this was later modified in the application to take into account the fact that the descent (6 seconds) is much shorter than the ascent.
Recreation of the lines layer
Mathematical Modeling (Excel to QGIS)
Before importation, normalization work was carried out via Excel to guarantee the integrity of the topographic records.
- Conversion of Minecraft coordinates (x, z) to the cartographic standard (x, y).
- Application of the transformation logic y = -z to respect geographic orientation.
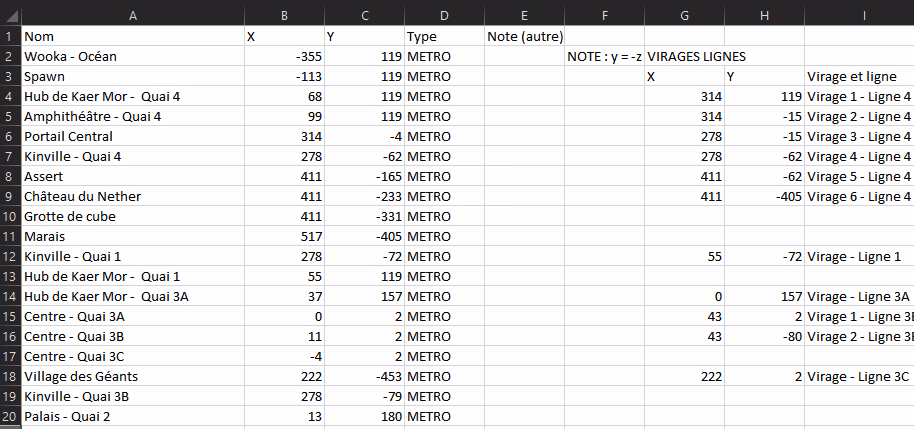
Excerpt of the Excel used for note-taking
I used the CSV format to go from raw Excel to QGIS. It is essentially a simplified Excel file.
I added a delimited text layer on QGIS to import the cleaned CSV file.
Finally, I used Points to Path to connect the stations into lines.
With the management of hubs thanks to the hub_id, I finally had a perfectly importable result for the second phase of the project: the web application.
The final map displayed on QGIS! I thickened the lines to make them more visible
I then exported the station and line files in GeoJSON format, an industry standard, to have a file that is more easily usable in my application.
Creation and Implementation of the Web Application
The heart of the project rests on an intelligent route calculation engine, exported from QGIS to a lightweight web format.
- Local Architecture: all route calculations take place in the browser, which reduces calls to the server
- The background image is stored in an efficient and lightweight format (.AVIF) which improves speed and reduces the site's carbon footprint
- The website, just like my portfolio, is hosted by Infomaniak, a Swiss host that double offsets its carbon emissions
- Digital technology is an increasingly polluting industry and eco-design is becoming a major subject in contemporary computing
- Simple Techstack:
- React (JS, set of tools facilitating the development of contemporary web applications)
- Leaflet (JS, map display)
- Tailwind (CSS, display improvement).
- GeoJSON Import: Use of a file natively readable by Leaflet
- A Engine:* Implementation of a graph traversal algorithm adapted to physical constraints:
- Variable speed depending on the material (blue ice vs packed ice)
- Adaptation of speeds according to those observed in the game (lower than theoretical ones)
- Time penalties for walking connections. These are only integrated inside stations
- Integration of elevators with fixed costs
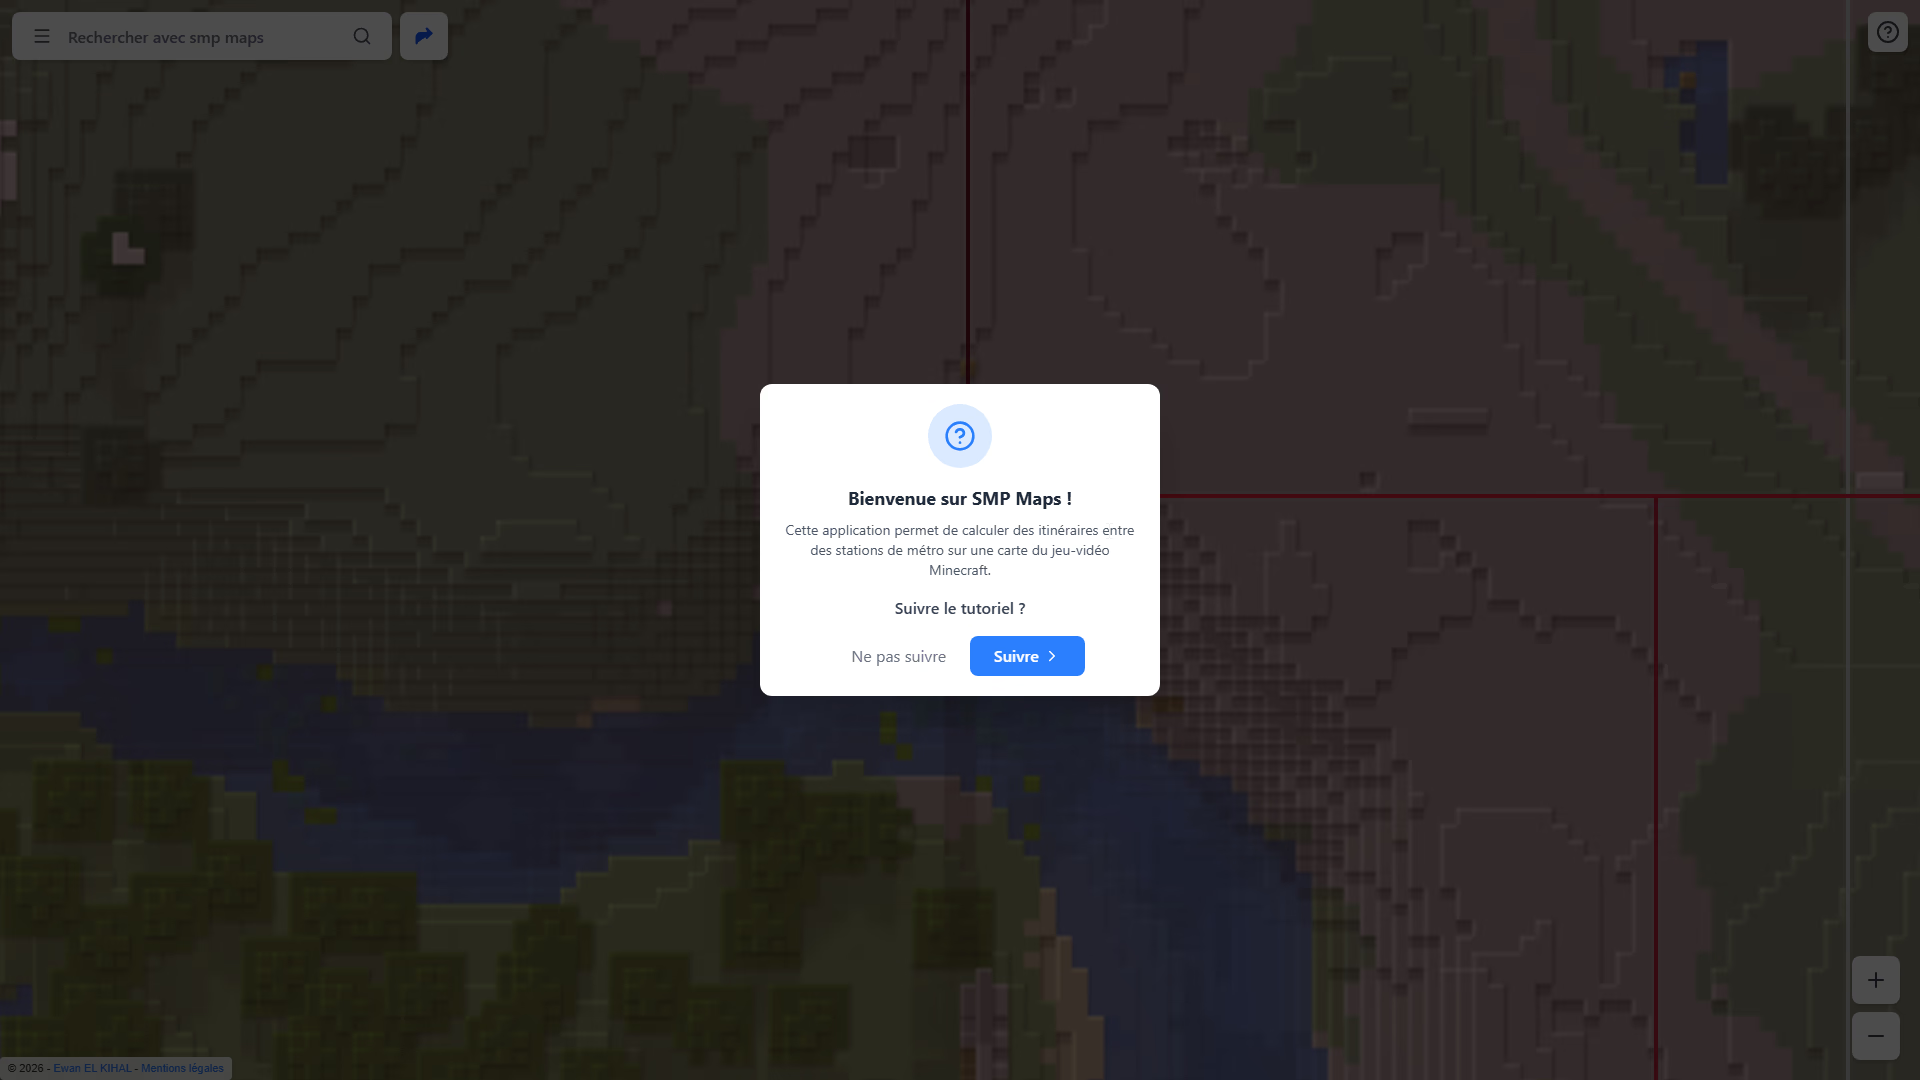
- Tutorial: Implementation of a tutorial to guide the user in using the application
- Improved Display: Numerous improvements were made to make the display clearer and less confusing.
The result is a complete application, with very realistic times compared to the game (or even identical. The margin of error is low).
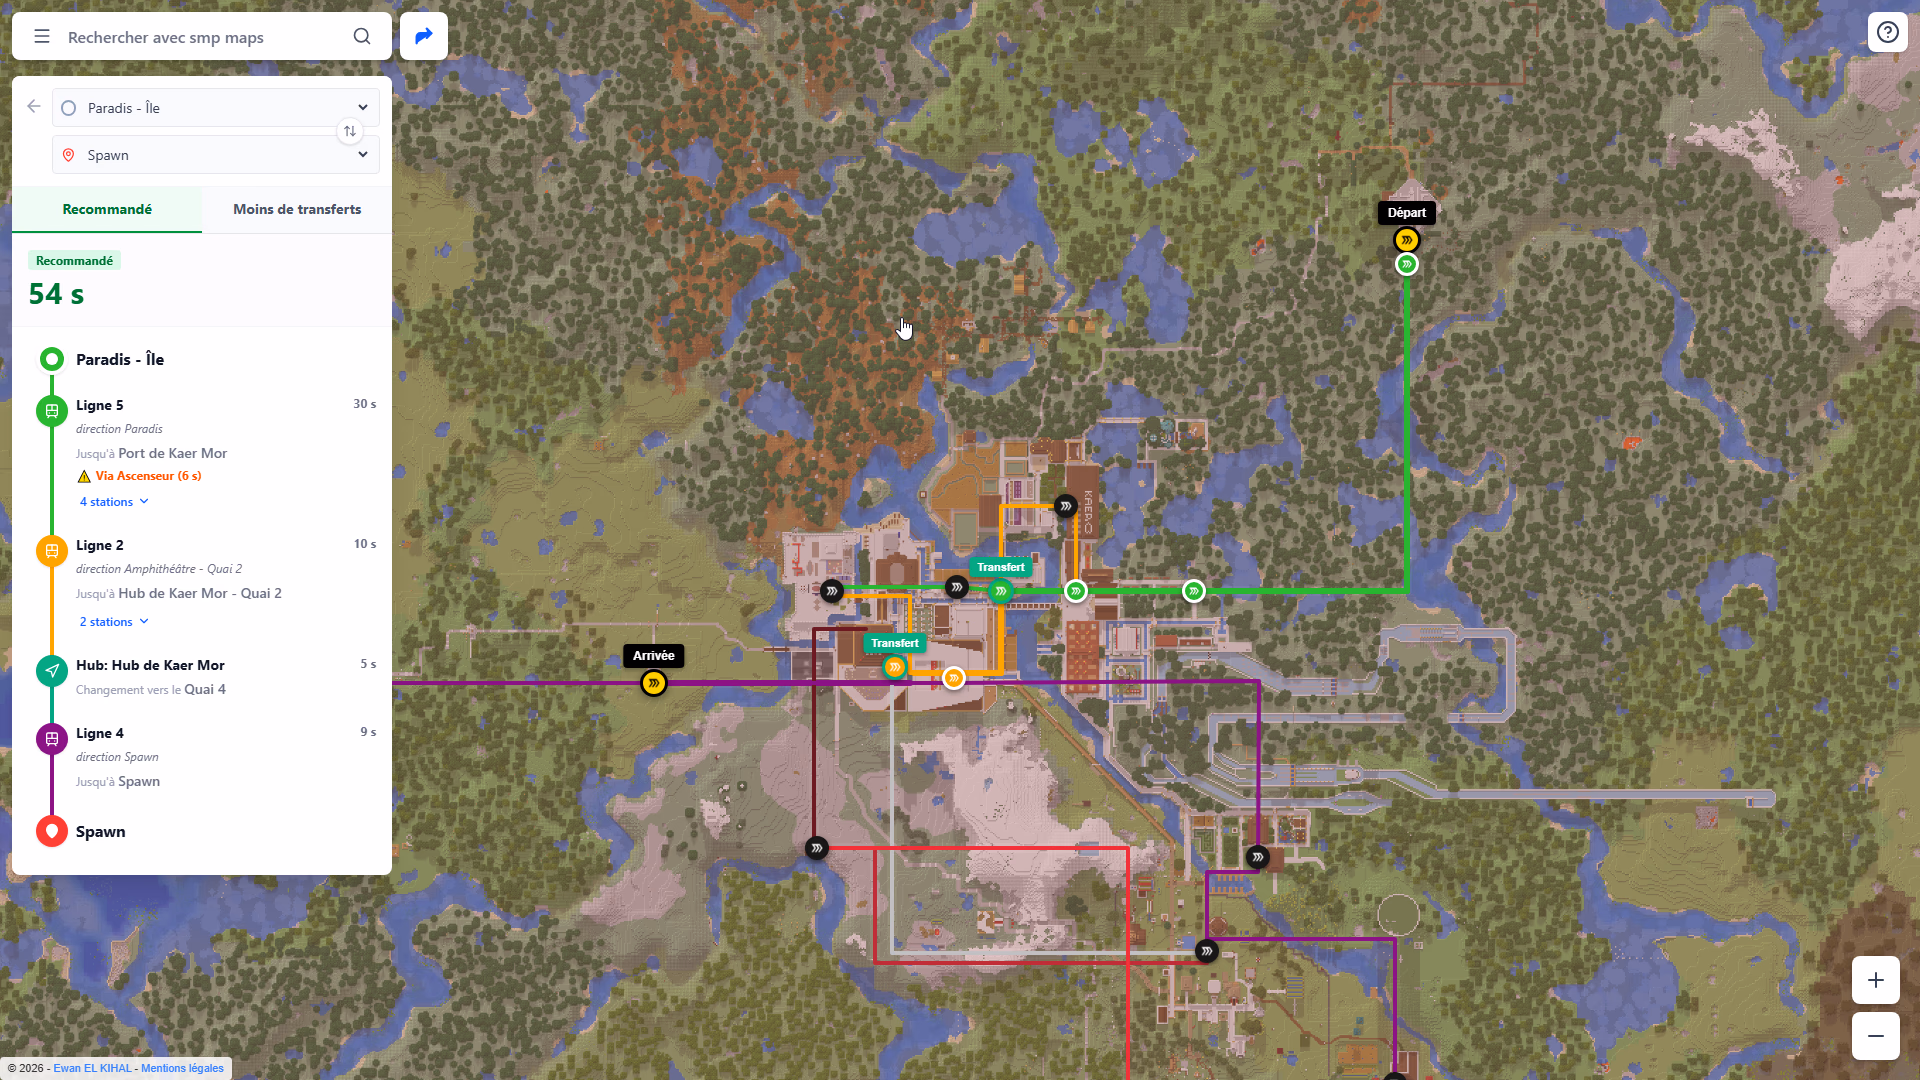
Example of an itinerary generated by the application
Visualization & UX:
The aim of the project is to offer a readable interface, inspired by industry standards, mainly Google Maps.
Visual Hierarchy and "Casing"
To solve the readability problem on a complex background, I used the "casing" technique: a double tracing of the lines (thick white outline + line color) allowing the network to visually detach from the raster map background.
User Experience (UX)
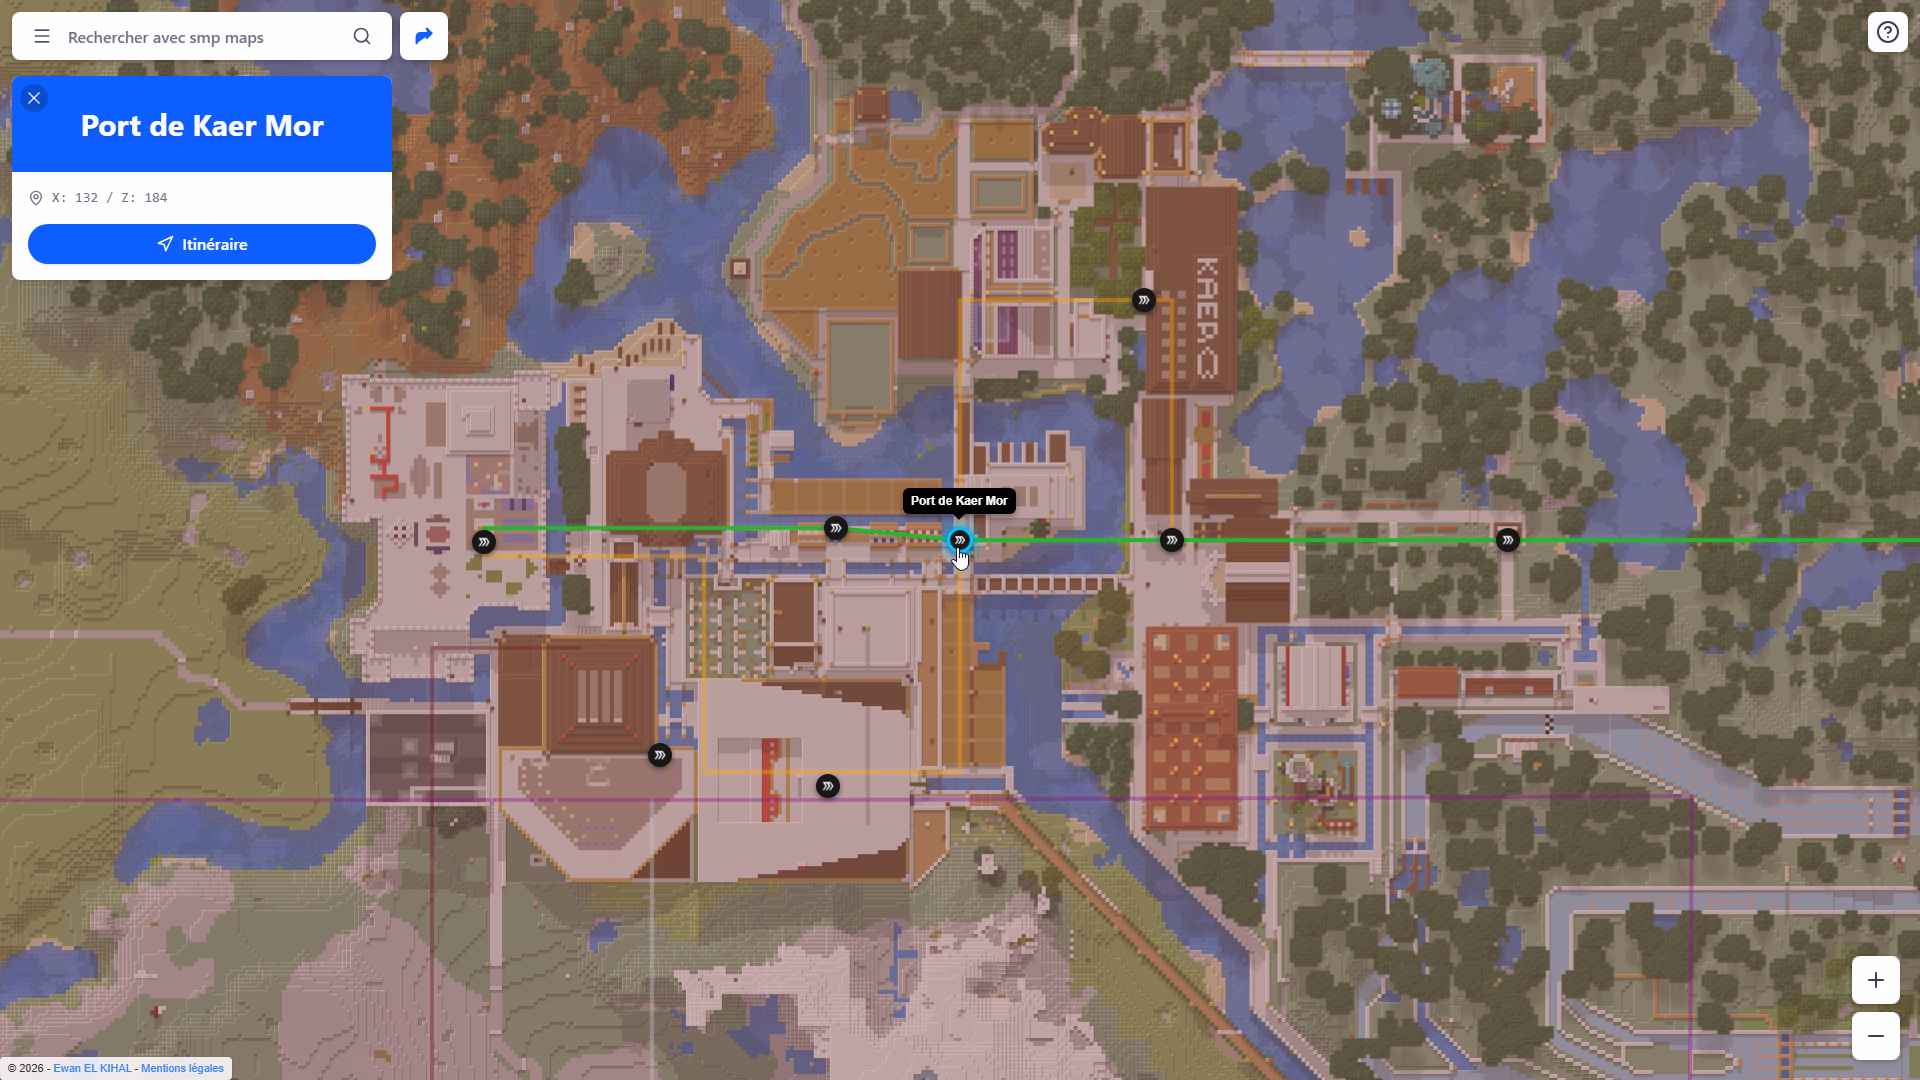
The interface offers dynamic visualization: the map background is grayed out, stations crossed in an itinerary are circled, departure and arrival stations are clearly marked, and transfer stations are well defined.
Hubs are also grouped visually, with a specific gray dotted display for connections between platforms.
In the left panel, the stations traversed are displayed, as well as the direction and the station at which to get off. Indeed, in the game, stations are made such that only the next station is displayed. Having the direction is thus crucial.
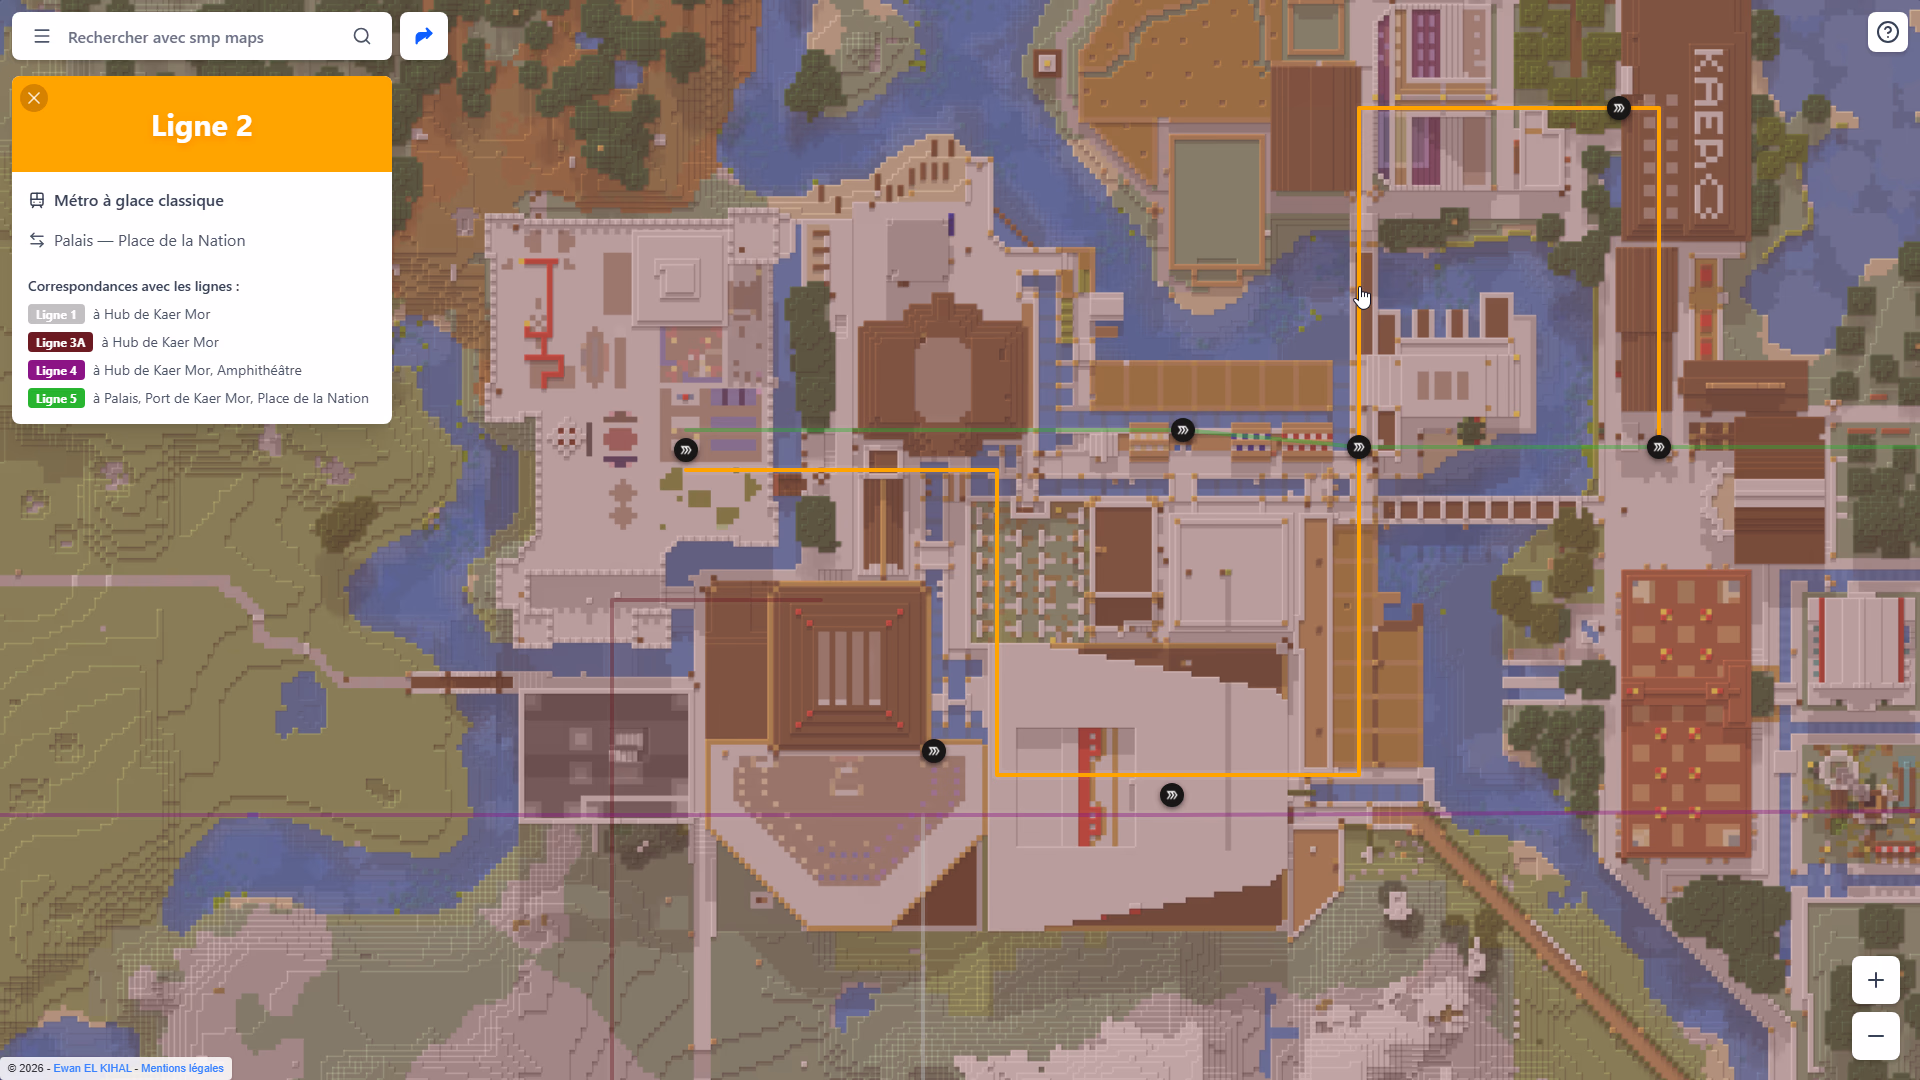
If you move your cursor over a line, it is visually highlighted, with increased opacity, and the rest of the map is grayed out further. The current itinerary also features a similar effect.
By clicking on a line or a station, you get its detailed information.
Future Improvements
Bug fixes as well as visual improvements are coming to improve the site's ergonomics and its visual aspect.
It is also potentially planned to add a more complete route calculation system, notably including support for paths, "off-road", carts (minecarts), and more.
Summary and Key Skills
This cross-disciplinary project allowed me to consolidate varied technical skills:
- GIS (QGIS): Georeferencing, coordinate systems, raster/vector manipulation
- Data Management: Cleaning, transformation, and structuring of spatial data
- Development: Algorithmic logic applied to transport
- Urban Planning Vision: Capacity to model complex multimodal transport flows
Gallery
Map display